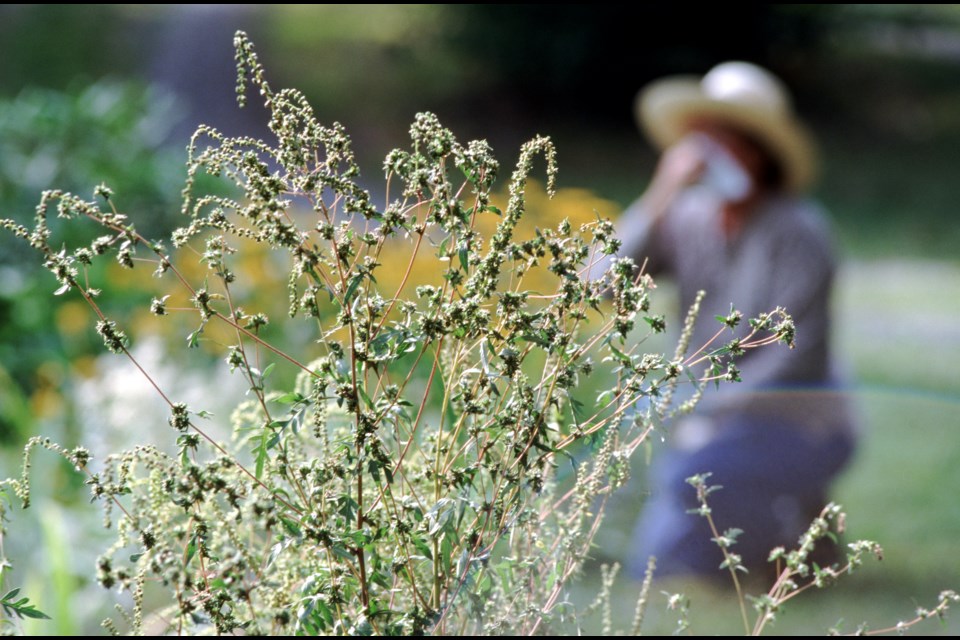
If you are like many allergy sufferers in the Lower Mainland, spring means enduring sniffles, puffy, itchy and watery eyes, and a weird scratch at the back of your throat.
"Is it allergies or COVID?" you wonder.
Before reaching for the at-home COVID test, you check the Weather Network's Allergy Outlook page.
Bingo. The site shows cedar and juniper pollen counts are "very high," and birch is "high."
The data for those counts is provided by Aerobiology Research Laboratories.
The company monitors and analyzes outdoor allergen levels across Canada.
That data is used for reports and forecasts for media, allergists, research institutions, and pharmaceutical researchers.
(The company also has an app called Allergy Sufferers that displays allergens, including pets.)
The Lower Mainland pollen station is in Vancouver.
The forecasts, which can stretch up to four days, are good for a 100-kilometre radius from the site, so includes the Sea to Sky Corridor.
Birch impacts many people, says Daniel Coates, director of Aerobiology Research Laboratories, as he read the Easter weekend forecast on his computer.
"Saturday, birch will drop a little bit, cedar is going to be really, really high and then [birch is] back up for Sunday, Monday. So it's not going to be the most wonderful weekend for you. Alder is at lower levels, though and so are maple and poplar."
Its forecasts are 80% accurate, Coates said.
The company has been in business since 1992.
"We originally started as a hospital experiment at the Civic Hospital in Ottawa, but then brought it into a business because there was nobody that does pollen and spore forecasts or even research in Canada," Coates said.
Courtesy Aerobiology Research Laboratories
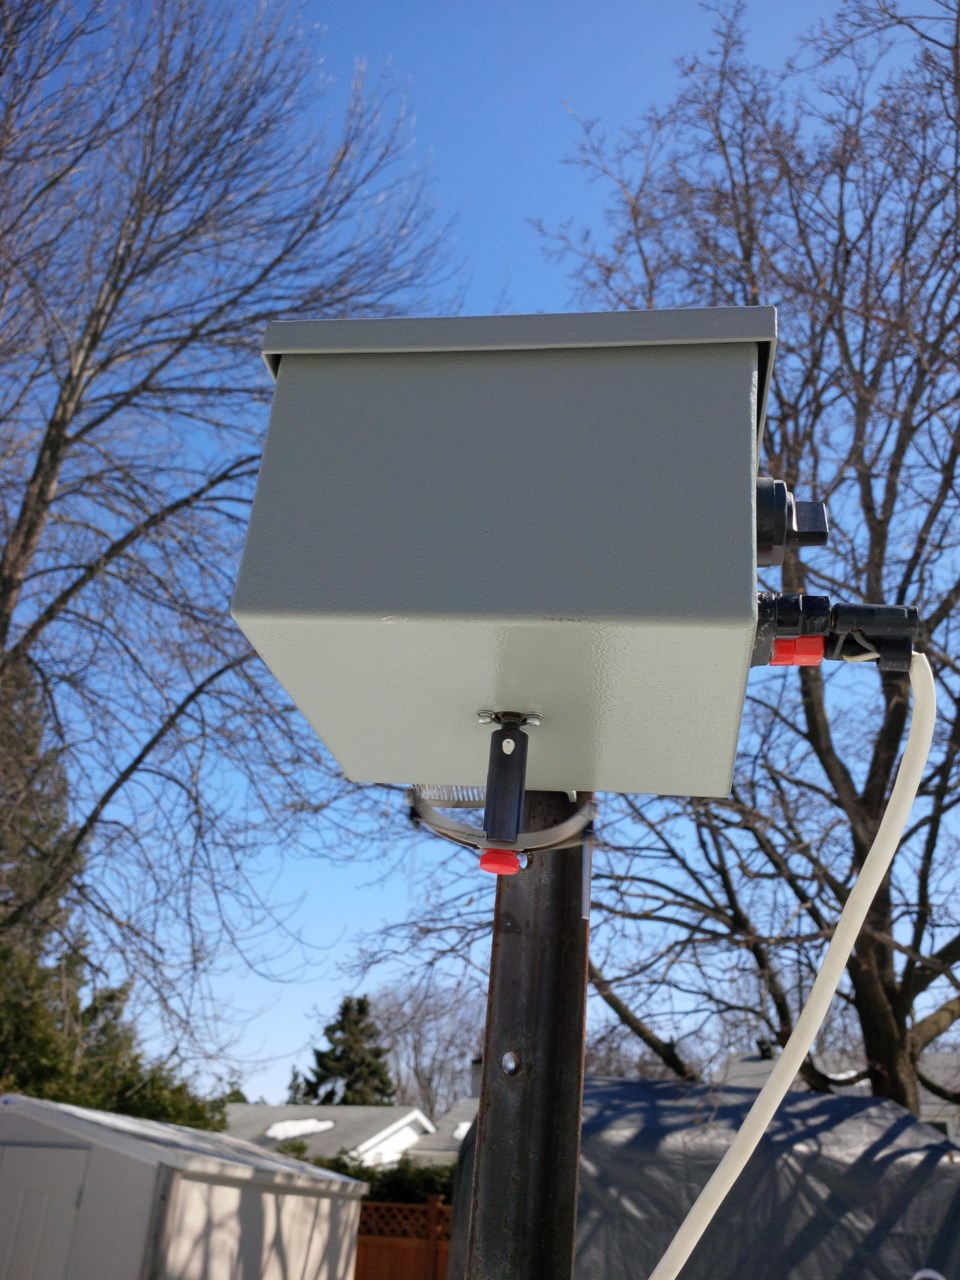
How are the pollen counts collected?
To get the information we see when we look up pollen counts, “rotation-impaction samplers” first collect samples from the air, inside a non-descript box on a pole.
"[Inside], there's this machine, and it holds these two rods and what happens is every nine minutes, it'll go on for one minute and spin at 2,400 rpm. And these little rods have silicone grease. Whatever is in the air basically attaches to silicone grease," Coates explained.
The company is working on real-time sampling technology, but currently, every day, human monitors head to the company's 30 stations across Canada to swap out and package up the rods and ship them to the company's lab back east for analysis.
At the lab, the pollen and spores are assessed under a microscope. They are counted, and a mathematical equation is applied to come up with the grains per cubic metre.
Low levels are anywhere from one to 20 grains; 21 to 80 is moderate; 81 to 200 is high, and then anything above 201 is considered very high, he said.
"In British Columbia, we will get cedar that's in the thousands of grains in a day," Coates said.
Because B.C. is warmer, the pollen samplers are put out in out late January or early February, while the rest of the country gets theirs closer to mid-March.
Looking at data from the Vancouver station, Coates said there's been more overall pollen, but less highly allergenic pollen so far this season. And allergy season started around the typical time in March.
"You've had more cedar pollen this year, which is not considered highly allergenic," he said, noting alder has been lower than it typically is.
More generally, by studying all the data across time, you can see trends emerge.
"What we are seeing is more pollen, longer [seasons] and more pollen in the air on an annual basis over a trendline," Coates said, explaining that this doesn't mean year-over-year there is a straight line up.
"It's a lot like a business cycle: up down, up, down, up, down, up-down. But when you do a trendline, it basically takes all points, intersects them and says OK, where's the trend? The trend in Canada is that we are seeing more pollen and longer seasons, but it's not apocalyptic. It's not going up like a rocket in the air. It is going up like a tiny hill that you're biking up."
He said while climate change is undoubtedly a factor, other variables' impact counts, too.
"Urban planning can affect pollen levels as well because cities like to plant male trees," he said. "The reason they do that is because male trees don't produce flowers or fruit. And so they're less messy, less maintenance to be done. But they do produce pollen."
Another factor that can impact pollen counts is construction, he said.
"Ragweed loves, loves living in looser land where construction is," he said. " So, more construction will mean more ragweed, which will mean more ragweed in the air, which will show up in our reports, too."
Find out more about the company on its website.


