The B.C. Coroners Service confirmed in early June that 619 people across B.C. died from last year’s record-breaking temperatures, which surpassed 40 C for several days in June and July.
More than half of the deaths happened on June 28 and 29, the hottest days.
The heat killed four orders of magnitude more farm animals across B.C. Approximately 651,000 chickens, turkeys, cows, pigs and other animals meant to become dinner or produce for dinner died in the heat between June 24 and June 30, according to industry groups.
Scientists have also estimated a billion sea creatures in the Strait of Georgia and Puget Sound died in the heat. More recently, University of British Columbia researcher Chris Harley says that estimate could be as much as 10 times higher, so 10 billion critters. That’s more than four to five orders of magnitude more sea critters than farm animals.
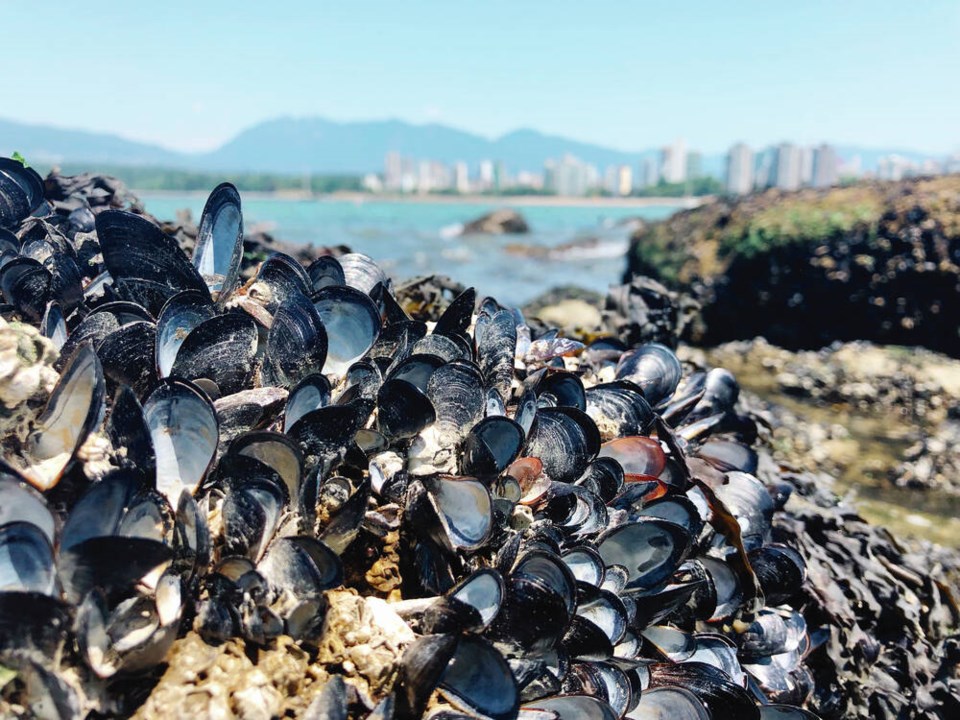
According to a new study published in the journal Ecology, some sea creatures fared better than others. Species that were able to burrow into the sand or were closer to the water at low tide, for example, were either able to escape the heat or survived because they were exposed to it for fewer hours.
Those that lived on the outer coast also managed better because the tide was out earlier in the day, when it wasn’t as hot, and then came in as the air temperature rose. And shellfish that were cemented onto rocks in the shade during the heat of the day experienced less damage than those with greater exposure.
In other words, populations of sea critters whose mobility, life strategies and living conditions limited their exposure to the heat and sun — in terms of the timing, intensity or duration of exposure or any combination of the three — did better than those with fewer options.
The same could be said of farm critters. The flocks, herds and sounders sheltered in barns with effective cooling systems, those that could get out of the sun and heat, and those that had access to water to cool off — sprinklers, ponds or creeks — fared better.
And, again, we could apply that to people. According to the B.C. Coroners Service report, 98 per cent of the heat-dome deaths occurred indoors and more than half of those who died — 56 per cent — lived alone. Most lacked cooling systems like air conditioning or fans and lived in “socially or materially deprived neighbourhoods.”
In other words, they tended to live in poorer households with less access to green space, recreation and education and in older buildings with inadequate shading, insulation and cooling options. They also tended to have fewer social connections — people to check in with and to check in on them — and fewer options or opportunities to get to places where they could cool down.
Building design was found to have made a huge difference in home heat and energy loads and deaths during the heat dome south of the border. Researchers found that homes in Washington and Oregon that were painted lighter colours — which reflect more sunlight — and that captured cooler night air and had well-controlled shading experienced significantly fewer hours when indoor temperatures exceeded the “caution,” “extreme caution,” “danger” and “extreme danger” thresholds.
In Portland, the researchers found that integrated shading — i.e., exterior shading of windows and shading from trees — and natural cross-ventilation eliminated all hours above the danger threshold during the three-day heat event, lowering peak indoor air temperatures by approximately 14 C and reduced air-conditioner loads by 80 per cent.
Neighbourhood design and streetscaping would also help. A recent City of Vancouver study found a difference of 8 degrees C between neighbourhoods with more tall trees and those dominated by asphalt on a hot summer’s day.
A 2018 Vancouver Parks Board report showed the average land surface temperature on a hot day in Vancouver varied by more than 20 degrees C between the coolest and hottest city blocks. It also found streets in less affluent areas, which usually have fewer trees, were the hottest.
Just as clams able to burrow into the sand and mussels living on the shady side of their rock managed the heat better, people who were able to get themselves to the beach or an air-conditioned mall, library, community centre or cooling centre or who lived in cooler buildings and greener, cooler neighbourhoods did better, too.
keiran_monique@rocketmail.com
>>> To comment on this article, write a letter to the editor: letters@timescolonist.com


