Less food is being trashed in the capital region, but the local building boom is resulting in an increase in the amount of wood waste crossing the scales at the Hartland dump.
Every five years the Capital Regional District does an audit of what makes up the solid waste stream. The results of the 2016 audit are in.
“There were no huge surprises, for sure. There’s always a number of things that can be tweaked,” said Russ Smith, CRD senior manager of environmental resource management.
Not surprisingly, given the 2015 launch of the regional food scrap collection program and kitchen scrap ban, the amount of organic waste being tossed out is down substantially, to 75 kilograms per person compared with 120 kilograms per capita in 2010.
“The fundamental piece we’re interested in is understanding, has per capita kitchen scraps — organic waste, basically — gone down? Which it has. It’s gone down by almost 40 per cent,” Smith said.
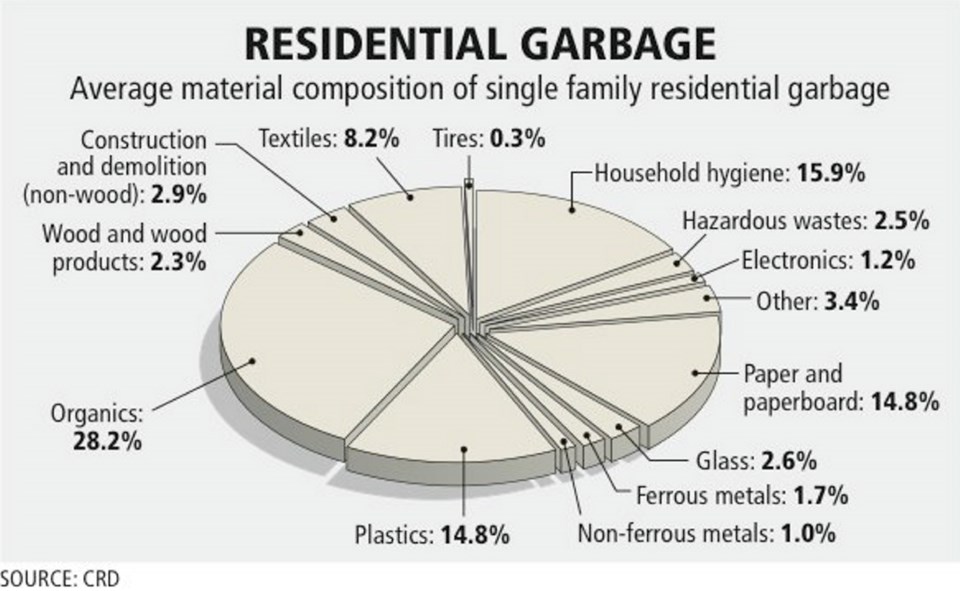
But there’s still work to do. Residents in the CRD each send an estimated 357 kilograms of waste a year to the landfill. Organics are still the largest single component of the total waste stream, at 21 per cent.
“It’s trending in the right direction but what it allows us to do is double down our efforts and continue to nudge that number in the right direction,” Smith said.
The amount of wood waste crossing the landfill scales is up by 15 per cent to 61 kilograms per capita from 53 kilograms. The majority of wood products are from construction and demolition and are treated or painted.
Construction and demolition materials make up the largest combined material category at 23.7 per cent.
Smith said the construction boom is definitely contributing to the increase but it is also influenced by the fact the Tervita Highwest Landfill in the Highlands was closed for the majority of 2016.
“We know construction activity obviously was up a lot and then the second piece is we’re seeing more through our landfill because the traditional construction and demolition landfill that was used by a number of parties has been closed,” Smith said.
Other highlights of the study conducted by Tetra Tech include:
• We’re throwing out less; per capita waste generation continues to decrease.
• Paper and paper products being tossed decreased by 18 per cent to 55 kg per capita in 2016, from 67 kg in 2010. Paper represents the third-largest percentage of the waste stream at 15.4 per cent. Most of the paper being discarded is compostable soiled paper products (napkins, paper towels, tissues) that should be going into the green bin and not the trash bin.
• Plastics being discarded decreased by five per cent to 51 kg per capita from 54 kg. Plastics represent the fourth largest percentage in the waste stream at 14.3 per cent.
• Textiles have been relatively consistent since 2001, fluctuating between 15 and 23 kg per capita; 21 kg per capita was calculated in 2016.
In 2015, according to the study, 130,442 tonnes of garbage was disposed of in the capital region — 29,651 fewer tonnes than in 2009.